Crypto Fear and Greed Index Explained: What It Is and How to Actually Use It
The Crypto Fear and Greed Index gives you a single number from 0 to 100 measuring whether the market is panicking or overconfident. It has been in extreme fear for much of 2026. Here is what the index actually measures, where it comes from, and how experienced investors actually use it without treating it as a buy or sell signal.
TL;DR: The Crypto Fear and Greed Index is a daily sentiment indicator that scores market conditions on a scale from 0 to 100. Scores from 0 to 24 indicate Extreme Fear, 25 to 49 indicate Fear, 50 to 74 indicate Greed, and 75 to 100 indicate Extreme Greed. The index is calculated from six inputs: Bitcoin price volatility, market momentum and volume, social media sentiment, Bitcoin dominance, Google Trends search data, and surveys of market participants. The index has spent significant time in Extreme Fear through 2026, reaching a low of around 14 in mid-June during Bitcoin's 20 percent monthly drawdown. MediaCrypto note: the Fear and Greed Index is a sentiment snapshot, not a trading signal. Its most practical use is helping you understand the emotional temperature of the market at a given moment, which is more useful for avoiding mistakes than for timing entries or exits.
Every experienced crypto investor has looked at a chart during a severe drawdown and felt the urge to sell everything. And many of those same investors have looked at a chart during a parabolic run and felt the urge to buy more before the price goes even higher. The Fear and Greed Index was built to quantify exactly those emotional states, not because measuring them is interesting but because the historical pattern suggests the market as a whole tends to make its worst decisions at the extremes.
The famous quote often attributed to Warren Buffett, be fearful when others are greedy and greedy when others are fearful, describes the contrarian insight that the Fear and Greed Index attempts to make actionable. Whether you use it that way depends on how you think about market sentiment, but understanding what the index actually measures is the necessary starting point.
What the Index Measures and How
The Crypto Fear and Greed Index was created by Alternative.me and updates daily. It combines six different data inputs into a single score, with each input weighted differently.
Price volatility accounts for 25 percent of the score. This component measures Bitcoin's current price volatility relative to its average volatility over the past 30 and 90 days. Unusual volatility, particularly to the downside, contributes to a Fear reading.
Market momentum and volume also accounts for 25 percent. This compares current market volume and momentum to the 30 and 90 day averages. High buying volume in a positive market trend contributes to Greed. Low or declining volume during a downturn contributes to Fear.
Social media sentiment accounts for 15 percent. The index scrapes Twitter and Reddit for crypto-related posts and analyzes the rate of interaction and sentiment of those posts. Rapid increases in engagement with positive framing push the score toward Greed. Panic-driven negative engagement pushes toward Fear.
Surveys account for 15 percent, though this component is noted as currently paused on the index's methodology page. When active, it polls a sample of crypto market participants directly about their market sentiment.
Bitcoin dominance accounts for 10 percent. When Bitcoin's share of the total crypto market cap rises, it is often interpreted as investors moving out of riskier altcoins and into the perceived safety of Bitcoin, which the index treats as a Fear signal. Falling Bitcoin dominance, suggesting capital flowing into altcoins, is treated as a Greed signal.
Google Trends accounts for 10 percent. The index analyzes search volume for Bitcoin-related terms. Spikes in searches for phrases like "Bitcoin crash" or "crypto sell" suggest Fear. Spikes in searches like "how to buy Bitcoin" or "crypto price" from new entrants suggest Greed.
How to Read the Zones
The five zones correspond to specific score ranges and each has a different behavioral implication.
Extreme Fear, from 0 to 24, is where investors are panic-selling, capitulating, or simply too frightened to buy. Historically in crypto, extended periods of Extreme Fear have often corresponded to bottoms or near-bottoms of corrections, because they reflect a state where most of the weak hands have already sold and the sellers are running out of new participants to sell to.
Fear, from 25 to 49, reflects broadly cautious market sentiment without the acute panic of the extreme zone. Investors are nervous but not capitulating en masse.
Neutral, around 50, is where the index spends relatively little time. Markets tend to move through the neutral zone quickly in either direction.
Greed, from 50 to 74, reflects broadly positive sentiment where investors are more willing to take risk and prices are typically rising. This is a comfortable zone that does not by itself signal excess.
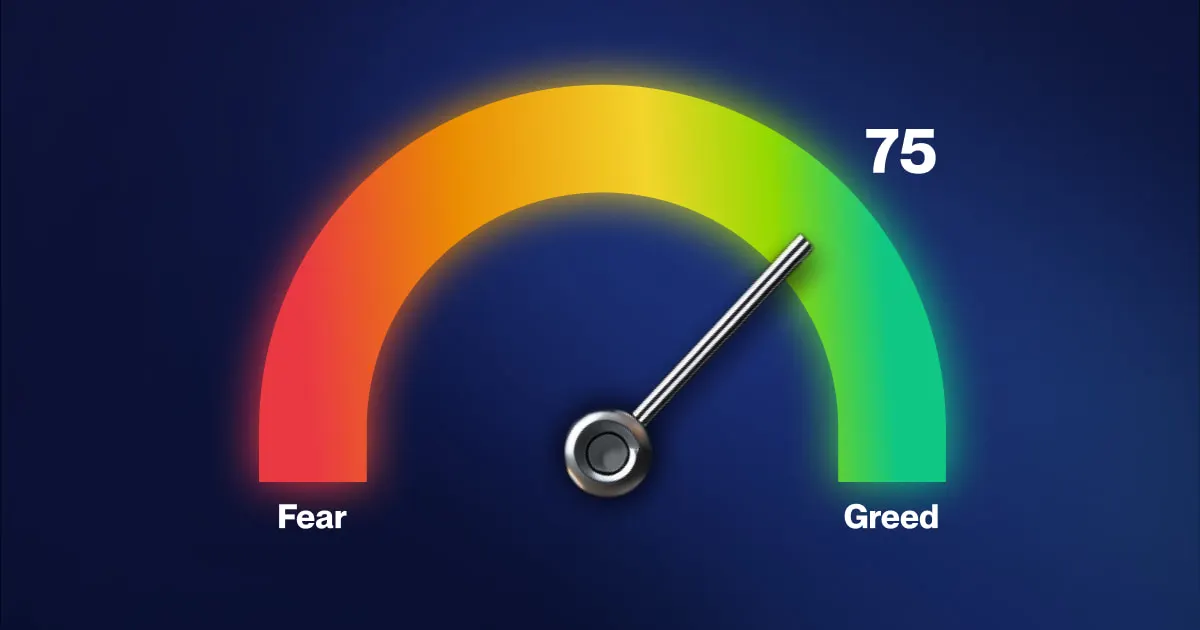
Extreme Greed, from 75 to 100, is where the most dangerous market conditions historically arise. In this zone, new investors are entering the market for the first time driven by headlines about prices going up, experienced holders are taking profits, and the conditions for a sharp reversal are most present. Bitcoin hitting its January 2026 all-time high near $109,000 coincided with an Extreme Greed reading.
What the Index Has Shown in 2026
The Fear and Greed Index has been a useful real-time document of 2026's market conditions. As Bitcoin rose toward its January high, the index was deep in Extreme Greed territory. Through the correction that followed, driven by the Iran conflict, BOJ rate hike concerns, and ultimately the 20 percent June drawdown, the index fell progressively toward Fear and then Extreme Fear.
At its lowest point in mid-June 2026, the index reached approximately 14, deep in Extreme Fear territory. MediaCrypto covered this in the context of the BOJ rate decision, noting that the muted market reaction to the rate hike despite extreme fear positioning suggested that a lot of the bearish sentiment had already been priced in. By late June, the index had recovered somewhat to around 25, suggesting the most acute fear had passed even as the price remained well below earlier highs.
How Experienced Investors Actually Use It
The most common mistake beginners make with the Fear and Greed Index is treating it as a buy or sell signal in a direct, mechanical way. If Extreme Fear means buy and Extreme Greed means sell, it sounds simple. The problem is that a market in Extreme Fear can keep falling, and a market in Extreme Greed can keep rising, sometimes for weeks or months. The index tells you about sentiment, not about timing.
What the index is more practically useful for is preventing the behavioral mistakes that sentiment extremes tend to produce. When the index is at 14 and everything feels hopeless, having a reference that shows you this is the same emotional condition that has historically corresponded to good long-term entry points can help you avoid selling at the worst possible time. When the index is at 90 and every headline is telling you prices are going to the moon forever, having a reference that shows you this is the emotional condition that has historically preceded the sharpest reversals can help you avoid buying at the worst possible time.
The index is a mirror for crowd psychology, not a predictor of price. Its practical value is in helping you recognize when your own emotional state might be mirroring a collective mistake rather than reflecting clear thinking.
Using It Alongside Other Indicators
The Fear and Greed Index becomes more useful when combined with other signals rather than used in isolation. For example, an Extreme Fear reading combined with declining exchange reserves and continued long-term holder accumulation on-chain provides a more complete picture than any of those signals alone. MediaCrypto regularly references the index alongside on-chain data, ETF flow data, and technical levels precisely because no single indicator tells the full story.
Similarly, an Extreme Greed reading combined with record retail search volume for Bitcoin and rapidly increasing leverage across futures markets is a more meaningful warning signal than Extreme Greed alone, because it suggests multiple indicators simultaneously pointing toward excess.
The index updates daily and is freely available at alternative.me/crypto/fear-and-greed-index. For any investor who checks crypto prices regularly, spending thirty seconds each morning looking at where the index sits takes less time than any other form of market research and provides a useful emotional calibration before you make any decisions about your portfolio.
About the Author
This article was researched and written by the MediaCrypto editorial team. MediaCrypto is a cryptocurrency news and market analysis publication covering Bitcoin, Ethereum, altcoins, regulatory developments, and market trends. Follow our daily analysis on X at @MediaCryptoAI.
Follow us on X: https://x.com/MediaCryptoAI
FAQ — Crypto Fear and Greed Index Explained
What is the Crypto Fear and Greed Index? The Crypto Fear and Greed Index is a daily sentiment indicator that scores market conditions from 0 to 100. Scores from 0 to 24 indicate Extreme Fear, 25 to 49 indicate Fear, 50 to 74 indicate Greed, and 75 to 100 indicate Extreme Greed. It is calculated from six inputs including Bitcoin price volatility, market momentum, social media sentiment, Bitcoin dominance, and Google Trends data.
Who creates the Fear and Greed Index? The Crypto Fear and Greed Index is created and maintained by Alternative.me, a data analytics platform. It updates daily and is freely available at alternative.me/crypto/fear-and-greed-index.
What does Extreme Fear mean for Bitcoin's price? Historically, extended periods of Extreme Fear in the index have often corresponded to bottoms or near-bottoms of corrections, because they reflect a state where most sellers have already exited and panic selling is exhausting itself. However, Extreme Fear does not guarantee an immediate price reversal and markets can remain in fear conditions for extended periods.
Can I use the Fear and Greed Index to time trades? It is better used as an emotional calibration tool than a precise trading signal. The index tells you about collective market sentiment, not about timing. A market in Extreme Fear can keep falling, and a market in Extreme Greed can keep rising. Its practical value is in helping you avoid making the behavioral mistakes that sentiment extremes tend to produce.
What was the Fear and Greed Index during Bitcoin's 2026 correction? The index fell to approximately 14, deep in Extreme Fear territory, during Bitcoin's 20 percent June 2026 drawdown. It had been in Extreme Greed territory around Bitcoin's January 2026 all-time high near $109,000, illustrating the full range the index can cover within a single year.
For live crypto prices and market data see read this article
Read also: How to Read Crypto Charts for Beginners 2026 — read this article
Read also: Bitcoin Price Prediction July 2026 — read this article
This article is for informational purposes only and does not constitute financial advice. Always do your own research before making investment decisions.